
Blogs
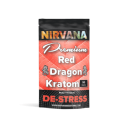
Daily life can feel like an uninterrupted procession of deadlines, responsibilities, and distractions. Within conversations about botanical products, Red Bali Kratom frequently attracts attention for its reputation for relaxation. Some consumers also explore Red Bali Kratom Capsules because they prefer an enclosed format to loose powder. However, understanding this botanical requires more than appealing descriptions. Reported calm does not establish clinical effectiveness, and convenience does not eliminate risk. A thoughtful discussion must examine personal accounts, scientific uncertainty, product differences, and what sustainable daily balance actually involves.
Understanding Red Bali Kratom and Its Reputation
Kratom comes from Mitragyna speciosa, a tropical tree native to Southeast Asia. Its leaves contain biologically active compounds, including mitragynine and 7-hydroxymitragynine. These substances interact with opioid receptors and other signaling systems, helping explain why kratom can produce noticeable changes in how people feel. These mechanisms also contribute to its risks.
The words printed on a package deserve careful interpretation. A botanical name, color designation, or geographical reference should not be treated as a clinical specification. Readers should ask whether a description identifies verifiable ingredients or simply communicates a particular market identity.
Descriptions such as “soothing,” “restorative,” and “balanced” can sound precise while leaving essential questions unanswered. What was measured? Compared with what? For how long? Were unwanted effects recorded alongside desirable ones? Without those details, attractive terminology offers an impression rather than a dependable prediction.
What Does “Calming” Actually Mean?
Calm is a personal experience with several possible meanings. One person may describe reduced mental chatter, while another may mean physical heaviness or sleepiness. Those experiences should not automatically be grouped together as equivalent benefits.
For an informational discussion, it helps to separate three ideas: feeling relaxed, becoming sedated, and receiving effective treatment for a health condition. Each describes something different. A product that makes someone drowsy has not thereby demonstrated that it improves emotional resilience, treats anxiety, or produces restorative sleep.
Personal Accounts Versus Clinical Evidence
Testimonials can identify experiences worth investigating, but they cannot establish cause and effect. Expectations, surroundings, concurrent substances, and ordinary fluctuations in mood can influence an account. A persuasive review rarely controls for these factors.
The National Center for Complementary and Integrative Health states that research remains limited and that kratom has not been shown to be safe and effective for any medical use. Consequently, claims of dependable stress relief or established anxiety treatment exceed the available evidence.
Red Bali Kratom Capsules: Understanding the Format
An enclosed capsule changes how a product is presented. It does not independently establish its effectiveness, purity, or suitability for a particular person. Evaluating the container and evaluating its contents are separate tasks.
A useful comparison begins with the ingredient declaration. Does the label describe leaf material, an extract, or additional ingredients? Does the packaging explain what its quantities refer to? Are promotional statements supported by accessible information?
These questions matter more than polished packaging or reassuring photographs. A professional appearance can make a product easier to recognize, but appearance alone cannot answer scientific questions.
Why Capsule Count Is an Incomplete Comparison
Comparing two packages solely by the number of capsules can be misleading. Readers also need to understand what each capsule contains and whether the products are genuinely comparable.
Likewise, a stated quantity of plant material should not be mistaken for proof of a standardized therapeutic effect. “Measured” and “medically validated” describe different things. Precision in packaging does not resolve uncertainty about outcomes.
Read Beyond the Front Label
When examining Red Bali Kratom Capsules, consider whether the manufacturer provides a complete ingredient list, identifiable batch information, and accessible testing documentation. These are practical questions about transparency rather than endorsements of use.
Testing information also requires interpretation. Ask what was tested, which batch was examined, and what the reported results actually establish. A document addressing selected contaminants cannot demonstrate that a product treats stress or is appropriate for everyone.
The FDA has reported contamination involving Salmonella and concerning levels of heavy metals in some kratom products. This makes product transparency relevant, while also showing why botanical origin alone is insufficient reassurance.
Red Bali Kratom and the Limits of Everyday Relaxation
The idea of daily balance deserves a broader definition than temporarily changing how an evening feels. Balance may involve being attentive at work, emotionally available in relationships, and able to rest without persistent distress.
An honest assessment therefore considers functioning alongside sensation. Does a routine support clear decisions and dependable participation in everyday life? Does it address the source of strain? Does it remain manageable over time?
These questions prevent a fleeting impression from becoming the sole measure of success. They also encourage readers to distinguish an appealing experience from a sustainable strategy.
Recognizing Unwanted Effects
Kratom can cause nausea, constipation, dizziness, and drowsiness. Rare but serious reported effects include seizures, high blood pressure, and liver problems. Its longer-term effects remain incompletely understood.
These possibilities belong within any discussion of Red Bali Kratom Capsules and perceived calm. An account that highlights relaxation while omitting impairment or unpleasant symptoms gives an incomplete picture.
A balanced evaluation records both desirable and undesirable experiences. Feeling different is not, by itself, evidence of improved well-being.
Dependence Changes the Meaning of a Routine
Regular kratom use can lead to dependence and withdrawal. The FDA also describes cases involving tolerance, cravings, and continued use despite adverse consequences. Combining kratom with other drugs has been associated with serious harm.
Anyone considering use should discuss medications, other substances, and relevant health conditions with a qualified clinician. Persistent anxiety, disrupted sleep, or difficulty controlling use warrants professional assessment rather than reliance on product descriptions.
Building a More Thoughtful Approach to Daily Balance
Before evaluating any botanical, define the difficulty being addressed. Is the central problem an overloaded schedule, unresolved worry, loneliness, physical discomfort, or insufficient opportunity to rest? A precise question creates a more useful starting point than a vague desire to feel better.
Consider what improvement would look like in observable terms. Examples might include completing responsibilities without feeling overwhelmed, making time for meaningful conversation, or protecting an uninterrupted evening break. These goals keep the focus on everyday functioning.
When reading about Red Bali Kratom Capsules, apply the same scrutiny used for any health-related claim. Look for clear definitions, acknowledge uncertainty, and resist treating repeated marketing language as independent evidence.
A Measured Perspective on Calm
Achieving daily balance requires informed judgment, realistic expectations, and attention to the pressures shaping everyday life. Red Bali Kratom may carry a reputation for calming experiences, but reputation does not establish reliable benefits or freedom from harm. Understanding research limitations, evaluating claims carefully, and seeking appropriate support provide a stronger foundation for decisions about personal well-being.
Dietary Supplements Market: The Rise of Functional Nutrition and Wellness Products
By emmaverghise, 2026-10-22
Market Overview
The Dietary Supplements Market was valued at USD 209.54 billion in 2025 and is estimated to reach USD 228.05 billion in 2026. Polaris Market Research projects the market to reach USD 454.38 billion by 2034, representing a CAGR of 9.00% during the 2026–2034 forecast period. North America was the largest regional market in 2025, accounting for 33.3% of global revenue share. These figures frame a market shaped by preventive healthcare and demand for varied wellness products.
Product Innovation and Consumer Preferences
The report’s type segmentation includes vitamins, minerals, amino acids, botanicals, probiotics, enzymes, and other products. Vitamins represented the largest type segment in 2025, accounting for 35.10% of the market. Probiotics also held a notable share and are projected to grow at a 12.4% CAGR during 2026–2034. Polaris links this outlook to increasing consumer attention to digestive balance, gut health, and immunity support. Probiotic dietary supplements are therefore a relevant category for companies evaluating innovation and portfolio development.
The report also identifies a shift toward plant-based products as a potential opportunity for market participants. Plant-based nutritional products can appeal to consumers seeking products aligned with particular dietary preferences. The reference page identifies botanicals as a market segment but does not provide a separate numerical forecast for plant-based products. This trend should be distinguished from quantified segment performance.
Personalization and Application Opportunities
Dietary supplements are used across several application categories, including energy and weight management, bone and joint health, immunity, general health, and cardiac health. These categories create opportunities for brands to tailor product formats and messaging to distinct consumer needs. Personalized nutrition solutions are relevant to the report’s discussion of consumer-focused innovation and the use of data tools to assess customer feedback and emerging trends. Marketing statements must remain accurate and compliant.
End-use categories include adults, children, infants, pregnant women, and geriatric consumers. Adults are expected to be the fastest-growing end-use segment, registering a 9.06% CAGR during the forecast period. Polaris connects this performance to growing health awareness among working populations, fitness trends, and a stronger emphasis on preventive healthcare. These findings can help companies assess target audiences without treating all consumer groups as interchangeable.
Read More @ https://www.polarismarketresearch.com/industry-analysis/dietary-supplements-market
Digital Distribution and Market Challenges
Distribution is divided into online platforms and offline stores. The reference page identifies expanding e-commerce availability as a driver of market sales. Online channels give consumers access to a wide range of brands and specialized products, while supporting product discovery and direct engagement. However, the source does not report a separate numerical growth rate for the global online distribution segment.
Polaris also identifies high supplement costs as a restraint. Businesses must consider price positioning, product quality, and channel costs. For manufacturers and distributors, gut health supplements connect with the report’s probiotic growth discussion.
The report also describes the use of artificial intelligence in analyzing consumer feedback, ingredient information, market trends, and competitor activity. Such tools can support research, alongside regulatory review of promotional content.
Regional Outlook and Key Players
North America led the market in 2025 with 33.3% share, supported by preventive healthcare adoption and an established supplement industry. Asia Pacific is projected to record the fastest regional growth, with a 10.5% CAGR from 2026 to 2034. Polaris attributes the region’s outlook to increasing health awareness, rising disposable incomes, and a growing middle-class population. Regional dietary habits also influence supplement demand.
The report names Abbott Laboratories, Glanbia Plc, The Archer-Daniels-Midland Company, Nature’s Sunshine Products, Inc., GlaxoSmithKline plc, Amway Corp., Herbalife International of America, Inc., XanGo, LLC, PharmaNutrics Himalaya Global Holdings Ltd., Nutraceutics Corp., Pfizer Inc., and Bayer AG among the key players. Companies compete through innovation, partnerships, and product diversification. Nutritional supplement manufacturing strategies can be assessed against consumer needs, product quality requirements, and portfolio priorities, although the reference page does not provide a standalone forecast for manufacturing services.
More Trending Latest Reports By Polaris Market Research:
why-the-2026-memory-shortage-is-reshaping-ai-chip-supply-chains
global-optical-coherence-tomography-oct-market
pharmacy-benefit-management-market
Market Outlook and Forecast
The global Glioblastoma Multiforme Treatment Market was valued at USD 3.10 billion in 2025 and is expected to reach USD 3.43 billion in 2026, before rising to USD 7.02 billion by 2034. Across the forecast period from 2026 to 2034, the market is projected to expand at a compound annual growth rate (CAGR) of 9.5%. Polaris Market Research identifies increasing glioblastoma incidence, supportive government policies, and funding from non-government organizations as important demand drivers. For developers, providers, and investors, the outlook highlights treatment options for an aggressive, recurrent disease.
Treatment Modalities Shape Market Activity
Care for glioblastoma multiforme commonly combines surgery, radiation, and chemotherapy to remove, destroy, or slow the return of tumor cells. The market is segmented across surgery, radiation therapy, chemotherapy, targeted therapy, tumor treating fields (TTF) therapy, and immunotherapy. The mix reflects the complexity of care and the use of individual or combined approaches.
Radiation therapy for glioblastoma represented the largest treatment segment in 2025, accounting for 38.6% of the market. Polaris attributes this position to technological advances that support greater precision and more cost-effective, user-friendly products. Radiation is commonly used as an initial treatment or alongside surgery and chemotherapy, and it remains relevant when tumors recur. This segment underscores the importance of integrating treatment technologies into established care pathways.
Drug-Based Approaches and Emerging Options
Temozolomide is among the drug classes covered in the report. Polaris notes that using temozolomide with radiotherapy can make a tumor more sensitive to radiation than radiation alone. This supports the role of combination regimens in the treatment landscape. Temozolomide treatment is therefore a relevant topic for companies assessing established medicines and their place within multimodal care.
The report also covers targeted therapy and immunotherapy, alongside tumor treating fields therapy. These categories are important to monitor as research and clinical trials explore options for a disease characterized by recurrence, complex tumor heterogeneity, and rapid progression. Tumor treating fields therapy is included in the report's treatment segmentation, while Glioblastoma immunotherapy and Targeted therapy for glioblastoma align with the report's discussion of research into novel therapeutic strategies. These categories do not indicate that an emerging approach has displaced established treatment.
Read More @ https://www.polarismarketresearch.com/industry-analysis/glioblastoma-multiforme-gbm-treatment-market
Regional Demand and Commercial Context
North America held the largest regional share in 2025, at 41.8%. Polaris links the region's position to government funding initiatives, disease-awareness programs, the availability of medical facilities, reimbursement policies, and research and development efforts. These conditions matter to companies evaluating clinical and commercial engagement.
Asia Pacific is expected to record the fastest regional expansion, with a projected CAGR of 10.4%. The report points to a large patient pool and increasing healthcare research activity, as well as developments in healthcare infrastructure and surgical approaches. Businesses can assess local care capacity and research activity, while recognizing that regional projections do not guarantee product-level outcomes.
Industry Drivers, Challenges, and Key Players
Awareness campaigns and funding support from organizations such as the Brain Tumour Foundation of Canada, the National Brain Tumor Society, and the Cure Brain Cancer Foundation contribute to education and research activity. At the same time, the market faces substantial barriers: treatment costs can be high, long-term prognosis remains poor, recurrence can require repeated interventions, and tumor heterogeneity complicates personalized treatment development.
Key companies identified by Polaris include Amgen, Amneal Pharmaceuticals, Arbor Pharmaceuticals, F. Hoffmann-La Roche Ltd, Karyopharm Therapeutics, Inc., Merck & Co., Inc., Pfizer Inc., Sumitomo Dainippon Pharma Oncology, Inc. (Boston Biomedical, Inc.), Sun Pharmaceutical Industries Ltd., and Teva Pharmaceutical Industries Ltd. Their inclusion does not imply equal positioning across treatment categories.
Business Implications
The forecast points to a market shaped by established multimodal care and ongoing interest in novel therapies. For B2B stakeholders, strategic assessment should consider evidence generation, treatment integration, affordability, and regional healthcare infrastructure. Polaris's published figures provide a consistent baseline for evaluating the sector through 2034, while clinical outcomes and product-specific opportunities require separate assessment.
More Trending Latest Reports By Polaris Market Research:
very-small-aperture-terminal-market
commercial-kitchen-appliances-market
Market Overview
The 5G Infrastructure Market was valued at USD 14.32 billion in 2025 and is estimated to reach USD 18.11 billion in 2026, before rising to USD 122.64 billion by 2034. Polaris Market Research reports a CAGR of 26.95% for the 2026–2034 forecast period. Asia Pacific was the largest regional market in 2025, holding 38.0% share. These figures inform connectivity investment planning for telecom operators, technology suppliers, and business leaders.
Connectivity Requirements Across Industries
5G infrastructure comprises the hardware, software, and network systems used to deploy wireless networks, including base stations, antennas, and backhaul systems. According to the reference page, 5G enables faster data transfer, lower latency, and greater network capacity. These capabilities can support Internet of Things applications, autonomous vehicles, high-definition streaming, and services that depend on reliable data exchange.
The growth of connected devices is a market driver identified by Polaris. Businesses and consumers are adopting connected technologies across homes, workplaces, and industrial environments, increasing the need for networks able to manage substantial data volumes. IoT network infrastructure is therefore relevant to organizations planning connected operations, though specific requirements vary by application and deployment setting.
The report also describes growing cooperation between infrastructure providers and IT companies. Such partnerships can combine connectivity with services for enterprise customers. Polaris cites a February 2023 partnership expansion between Kyndryl and Nokia to deliver LTE and 5G private wireless services, Industry 4.0 solutions, and edge computing for enterprises. The example illustrates how network providers and IT specialists can package connectivity with broader digital capabilities.
Enterprise Use Cases and Network Performance
The end-use categories in the report are commercial, residential, government, and industrial. The commercial segment is expected to register a 25.50% CAGR over 2026–2034. Polaris connects this outlook to increasing corporate demand for bandwidth-intensive applications, including virtual meetings, cloud computing, and IoT-enabled smart workplaces. Enterprise 5G solutions can be evaluated in relation to these use cases, with network design matched to an organization’s coverage, performance, and operational needs.
The report’s discussion of 5G compared with 4G highlights differences in speed, latency, bandwidth, spectrum efficiency, architecture, enterprise capabilities, device connectivity, and energy efficiency. Low-latency connectivity is relevant where responsive communication and real-time data exchange matter. The reference page describes 5G as supporting cloud-native, software-defined, and virtualized network architecture, while also enabling private networks, smart factories, IoT ecosystems, and edge computing applications.
Read More @ https://www.polarismarketresearch.com/industry-analysis/5g-infrastructure-market
Polaris identifies government support and incentives as another driver. Regulatory assistance, spectrum allocation, and financial incentives can encourage deployment as part of broader digital-infrastructure strategies. ## Spectrum and Infrastructure Segmentation
The reference report segments the market by communication infrastructure, core network technology, and end use. Communication infrastructure includes small cells and macro cells. Small cells are expected to grow at a 29.50% CAGR during the forecast period, supported by demand for high-bandwidth coverage in dense locations and the ability to use higher-frequency spectrum. 5G spectrum utilization is consequently a relevant planning consideration for operators balancing coverage and capacity.
Regional Outlook and Competition
Asia Pacific held 38.0% of the market in 2025, with Polaris highlighting digitization and investment across countries such as China, South Korea, and Japan. North America is expected to record a 25.50% CAGR during 2026–2034, supported by investment from telecom operators, technology companies, and governments. India is projected to grow at a 32.40% CAGR over the period, with government-backed digitization and demand for dependable infrastructure supporting the outlook.
Major companies named by Polaris include Airspan Networks Holdings Inc., Altiostar, Ceragon Networks Ltd., Cisco Systems, Inc., Ericsson, Huawei Technologies Co., Ltd., Mavenir, Nokia Networks, Samsung Electronics Co., Ltd., and ZTE Corporation. The report describes competition shaped by research and development, product innovation, partnerships, collaborations, mergers, and acquisitions.
For B2B decision-makers, the outlook underscores the importance of aligning network investment with enterprise applications, regional conditions, and service requirements.
More Trending Latest Reports By Polaris Market Research:
top-data-center-interconnect-market-leaders-to-watch
process-mining-software-market
Automotive Electronics Market: Emerging Opportunities in Vehicle Safety Systems
By emmaverghise, 2026-10-22
The global automotive electronics market was valued at USD 344.93 billion in 2025. Polaris Market Research projects it will reach USD 373.88 billion in 2026 and USD 730.64 billion by 2034, growing at a CAGR of 8.70% during the forecast period 2026–2034. Growth is fueled by the rising adoption of electric vehicles and demand for advanced infotainment and safety systems. Key players include Alpine Electronics, Inc., Aptiv PLC, Autoliv Inc., BorgWarner Inc., Continental AG, Denso Corporation, Faurecia S.A., Hitachi Automotive Systems, Ltd., Hyundai Mobis Co., Ltd., Infineon Technologies AG, Magna International Inc., NXP Semiconductors N.V., Robert Bosch GmbH, Valeo S.A., and ZF Friedrichshafen AG. Five technology themes stand out for B2B decision-makers: advanced driver assistance systems, automotive sensors, electric vehicle electronics, automotive electronic control units, and connected vehicle technologies.
Safety Systems Anchor Demand in the Automotive Electronics Market
Advanced driver assistance systems are a key driver propelling the automotive electronics market. Features such as collision avoidance and adaptive cruise control rely on advanced electronic systems, with sensors, cameras, and processing units enhancing safety and driving comfort. Increased consumer awareness and regulatory emphasis on safety standards have made these capabilities integral to modern vehicles. The advanced driver assistance systems category is expected to grow at a 9.4% CAGR during the forecast period. These platforms combine radar, LiDAR, and camera technologies with control algorithms to enable lane departure warning, automatic emergency braking, and parking assistance.
Sensors Lead Type-Level Growth
Automotive sensors are expected to account for a high 9.5% CAGR during the forecast period. These devices monitor parameters such as speed, temperature, pressure, and distance, supporting emergency braking, engine control, tire pressure monitoring, and parking assistance. In July 2023, Littelfuse, Inc. unveiled its Current Sensing Resistor family, a more economical option for current measurement that supports battery charging and motor speed management while providing overcurrent protection. Given this growth outlook, automotive sensors warrant close attention from suppliers.
Read More @ https://www.polarismarketresearch.com/industry-analysis/automotive-electronics-market
Electrification Elevates Control and Power Requirements
The surge in electric vehicle adoption is propelling significant growth in the automotive electronics market. As the industry embraces EVs and hybrid models, demand for advanced components has surged. Electric vehicle electronics, including electric powertrains, battery management systems, and charging infrastructure, are essential to vehicle operation, while government promotion of sustainable transportation further supports adoption. Meanwhile, automotive electronic control units act as onboard computers that coordinate and regulate vehicle operation, covering engine management, brake control, airbags, and lighting systems. The implementation of virtual ECUs (vECUs) for high-performance computing is expected to create several market opportunities.
Connectivity Reshapes Buyer Expectations
Growing consumer interest in connected vehicles is driving substantial growth in the automotive electronics market. Connected vehicle technologies enable real-time data exchange, navigation, and smart features, and consumers are particularly drawn to seamless connectivity and smart functionalities. This interest propels innovation across telematics and in-vehicle entertainment.
Regional and Segment Outlook
Asia Pacific dominated the market with a 40.25% revenue share in 2025, supported by rising vehicle production, a shift toward electrified mobility, and its role as a manufacturing powerhouse, especially in China. Europe is expected to record the highest growth rate, at a 9.6% CAGR, owing to its highly developed automotive industry with giants such as Volkswagen, BMW, and Mercedes-Benz, and to European nations prioritizing vehicle safety and enforcing stringent emission standards. By vehicle type, passenger cars dominated with a 68.7% revenue share in 2025, and the OEM channel held an 81.2% share. High R&D and installation costs may present market challenges, so stakeholders should align investments with the high-growth areas of advanced driver assistance systems, automotive sensors, electric vehicle electronics, automotive electronic control units, and connected vehicle technologies.
More Trending Latest Reports By Polaris Market Research:
top-20-companies-in-printed-circuit-board-market-to-know-in-2025
europe-laundry-detergent-market
Valued at USD 7.81 billion in 2025, the large language model (LLM) market is projected to reach USD 10.65 billion in 2026 and USD 129.97 billion by 2034, growing at a CAGR of 36.7% during the forecast period 2026–2034. Competition is intense, with key players including Alibaba Group Holding Limited; Amazon.com, Inc.; Baidu, Inc.; Google LLC; Huawei Technologies Co., Ltd.; Meta Platforms, Inc.; Microsoft Corporation; OpenAI LP; Tencent Holdings Limited; and Yandex NV pursuing research and development, mergers and acquisitions, partnerships and collaborations. This article examines application demand, vertical adoption and the ecosystem dynamics shaping the market.
Customer Service Automation and Code Generation Lead Application Demand
The large language model market is segmented by application into information retrieval, language translation, localization, content generation, code generation and customer service automation. LLMs serve as the backbone of chatbot systems, allowing users to seek assistance or information without enduring lengthy support queues, which directly supports customer service automation. In India, startups, IT companies and large enterprises are adopting LLMs for customer support, content generation, code writing and data analysis. Code is also a distinct modality alongside image, text and video. The report contrasts LLM use cases such as chatbots, content generation and coding assistance with traditional machine learning use cases such as fraud detection, recommendation systems and predictive analytics.
LLM Adoption in BFSI Gains Momentum
The BFSI segment is expected to grow at a CAGR of 36.3% during the forecast period. Financial institutions are increasingly using LLMs to power AI chatbots, automate document processing, detect fraud and provide personalized financial recommendations, helping banks save time, reduce operational costs and improve customer experiences. Because security and data accuracy are critical in the sector, real-time data analysis and smart decision-making capabilities are central to LLM adoption in BFSI.
A recent example is EY India's March 2025 launch of a customized fine-tuned LLM for the BFSI sector, designed to enhance AI adoption, improve customer service and deliver up to 50% cost savings. Other verticals covered in the study include education, healthcare and life sciences, IT/ITeS, law firms, manufacturing, media and entertainment, and retail.
Read More @ https://www.polarismarketresearch.com/industry-analysis/large-language-model-llm-market
Natural Language Processing and Open-Source LLMs Shape Competition
LLMs advance natural language processing tasks such as summarization, translation, classification and sentiment analysis. In India, banking, retail and education are exploring LLM-based solutions, with growing interest in natural language processing and AI-driven automation. Major players have invested heavily in models such as BERT, GPT and T5, which are frequently shared with the broader community through open-source frameworks, fostering collaboration and innovation.
Meta Platforms' April 2025 release of Llama 4 Scout and Llama 4 Maverick illustrates the momentum behind open-source LLMs; both models are multimodal systems capable of processing text, images, video and audio. Partnerships between academia and industry contribute new techniques and algorithms, while startups explore niche applications. On the infrastructure side, Moreh announced in May 2026 that it validated LLM inference performance on the Tenstorrent Galaxy Wormhole system, achieving DGX A100-class performance with higher cost efficiency.
Regional Momentum in the LLM Market
North America dominated the market with a 42.0% revenue share in 2025, as the region hosts major technology companies and research institutions at the forefront of AI development. Asia Pacific is expected to record the highest CAGR of 37.9% during the forecast period. According to the ITU, 66% of the Asia Pacific population had internet access in 2023, and this digital transformation generates vast amounts of textual data, creating demand for LLMs that support multilingual and cross-cultural communication. In India, government initiatives promoting AI innovation and digital transformation further support market expansion.
Challenges and Strategic Outlook
Enterprises must manage high computational cost, data privacy concerns, hallucination issues, bias in training data and evolving global regulations. Companies that focus on innovation, responsible AI practices and user-centric design can differentiate their offerings and capture emerging demand.
More Trending Latest Reports By Polaris Market Research:
middle-east-hvac-systems-market
us-property-management-services-market
Digital Workplace Market: Enhancing Workforce Productivity Through Technology
By emmaverghise, 2026-10-22
The global digital workplace market is entering a phase of accelerated enterprise adoption. Valued at USD 60.46 billion in 2025, the market is projected to reach USD 81.21 billion in 2026 and USD 394.66 billion by 2034, growing at a CAGR of 23.2% during the forecast period 2026–2034. Key players shaping the competitive landscape include Fujitsu, Citrix Systems, Atos SE, IBM, Accenture, NTT Data Corporation, Zensar, The Hewlett Packard Enterprise Company, HCL Technologies Limited, Tata Consultancy Services Limited, DXC Technology Company, Cognizant Technology Solutions Corporation, and Wipro Limited.
What Defines the Digital Workplace Market
The digital workplace is a technology-driven virtual work environment that integrates collaboration tools, cloud platforms, communication systems, AI-powered productivity applications, and employee experience solutions. These digital workplace solutions support remote, hybrid, and office-based work, enabling workforce collaboration, workflow automation, and knowledge sharing. Compared with a traditional workplace, which depends on physical presence and manual, paper-based processes, a digital environment offers faster communication, greater operational flexibility, and centralized data access.
Hybrid and Remote Work Drive Enterprise Demand
Companies worldwide are shifting toward remote and hybrid work models, a trend that gained momentum after the COVID-19 outbreak forced organizations to close physical workplaces. Many businesses have since recognized the benefits, including lower operational expenditure and improved work efficiency. As flexible arrangements become a standard part of organizational strategy, demand continues to strengthen for tools that keep distributed teams connected and productive across industries.
Cloud Collaboration Gains Enterprise Preference
The rising need for efficient collaboration has increased adoption of cloud-based collaboration platforms such as Microsoft Teams, Zoom, Google Workspace, and Slack. These platforms support real-time communication, project management, and teamwork across locations while reducing reliance on traditional on-premises infrastructure. Companies also adopt Microsoft 365 and Asana, attracted by cost-effectiveness and easy integration. The subscription model cuts operational costs because organizations avoid investing in physical infrastructure, making deployment scalable and affordable.
Read More @ https://www.polarismarketresearch.com/industry-analysis/digital-workplace-market
Intelligent Assistants and Automation Transform Productivity
Artificial intelligence is reshaping how enterprises operate. Automation improves productivity in repetitive tasks such as scheduling, data entry, and ticketing, while intelligent virtual assistants such as Microsoft Copilot improve collaboration. AI copilots deliver task management, meeting summaries, scheduling, and content generation, which reduces manual workload and enhances decision-making efficiency. AI also strengthens cybersecurity by identifying and responding to anomalies. In April 2026, Kyndryl announced the Kyndryl Digital Twin for the Workplace, an AI-powered capability that helps organizations anticipate and resolve technology issues and avoid workflow disruption.
Integrated Communication Streamlines Operations
Within the solution segmentation of the digital workplace market, unified communication and collaboration stands alongside device management, mobility, and other categories. Unified communication platforms integrate messaging, video conferencing, email, and project management tools, which enhances communication speed, collaboration efficiency, and employee engagement. Users can access files and manage workflows in a single place, a capability enterprises increasingly prioritize as they build accessible and scalable digital workspaces.
Regional Leadership and Market Constraints
North America dominated the digital workplace market with a 45.10% share in 2025, supported by growing utilization of digital workstations across SMEs and large enterprises. The region is a hub for startups, medium-sized companies, and large organizations, and its growth is propelled by IoT, cloud computing, big data, AI, and automation.
Challenges remain. High implementation costs and integration difficulties with legacy systems continue to limit adoption, as new deployments often require significant upfront investment in software, infrastructure, and employee training. These barriers can delay decisions, particularly among small and mid-sized enterprises with limited budgets and technical resources. Ongoing technological advancement, however, presents an opportunity for vendors to build more capable, secure, and user-friendly offerings, differentiate themselves, and capture new demand.
Strategic Takeaway for B2B Leaders
For technology buyers and solution providers, the digital workplace market rewards early alignment with flexible work strategies, scalable cloud delivery, and AI-enabled productivity. Organizations that prioritize integration readiness and workforce enablement are better positioned to capture the value of this expanding landscape through 2034.
More Trending Latest Reports By Polaris Market Research:
natural-disaster-management-market
autonomous-mobile-robot-market
benchmarking-performance-top-5-companies-in-air-purifiers
fishing-apparel-and-equipment-market
waterproofing-membranes-market
Valued at USD 12.82 billion in 2025, the global Connected Car Market is projected to reach USD 14.44 billion in 2026 and USD 37.82 billion by 2034, growing at a CAGR of 12.78% during the forecast period 2026–2034. The market is shaped by advances in V2X communication, expanding connectivity options, and rising demand for safer, smarter vehicles. Leading companies in the Connected Car Market include BlackBerry, BMW Group, Cisco Systems, Continental AG, Delphi Technologies, Ford Motor Company, General Motors, Harman International (a subsidiary of Samsung Electronics), Intel, Mercedes-Benz, NVIDIA, Qualcomm, Toyota Motor Corporation, and Volkswagen Group.
Communication Type Insights: V2V and V2I
By communication type, the market is segmented into vehicle-to-vehicle (V2V) and vehicle-to-infrastructure (V2I) communication. V2X communication enables vehicles to communicate with surrounding cars and road infrastructure, contributing to better road safety, improved traffic flow, and reduced congestion. The vehicle-to-vehicle segment held a 58.0% share in 2025, supported by advances in communication protocols and regulatory support for cooperative safety applications such as collision avoidance and platooning. The vehicle-to-infrastructure segment is expected to register a 14.47% CAGR, as real-time data exchange with traffic lights, road sensors, and parking systems optimizes traffic flow. Governments and municipal authorities are also investing in smart city initiatives that integrate vehicle-to-infrastructure technologies.
Connectivity Types: Embedded, Tethered, and Integrated
Embedded connectivity relies on hardware integration of a SIM and modem in the vehicle, keeping it always connected for navigation and emergency applications. Tethered connectivity uses a smartphone hotspot, Bluetooth connection, or USB cable, offering low-cost access for mobile apps and web browsing. Integrated connectivity combines hardware and device connectivity, delivering advanced capabilities for smart cars. Additionally, 5G networks provide greater connectivity and speed, supporting real-time navigation, driver assistance features, vehicle monitoring, and internet access in vehicles.
Sales Channel Analysis: OEM Dominance and Aftermarket Momentum
The OEM segment held the largest share, at 78.0% in 2025, as automakers increasingly integrate advanced connectivity features during vehicle production. OEMs collaborate with technology providers to offer factory-installed solutions and value-added services such as over-the-air updates and predictive maintenance. The aftermarket segment is registering a higher growth rate of 10.29%, supported by rising adoption of connected car solutions in existing vehicles. Aftermarket solutions such as GPS trackers, dash cameras, and advanced infotainment systems benefit from affordability and availability in developing regions, while plug-and-play devices and wireless connectivity technologies have simplified integration. As the global vehicle fleet ages, demand for aftermarket solutions is expected to rise.
Read More @ https://www.polarismarketresearch.com/industry-analysis/connected-car-market
Cybersecurity Threats Challenge Market Expansion
Cybersecurity threats such as hacking and data breaches remain a significant restraint on the connected car market. As vehicles become more connected and data-driven, they are more exposed to unauthorized access and misuse of sensitive information. These risks can erode consumer trust, raise compliance and development costs, and slow the adoption of connected solutions. Manufacturers and service providers must invest in robust security frameworks to protect vehicle systems and user data, which will be essential to sustaining long-term market confidence.
Regional Analysis: Asia Pacific Accelerates
Asia Pacific is registering rapid growth at a CAGR of 16.44%, primarily due to automotive industry expansion in China, Japan, and South Korea. China is a major contributor, with the government pushing smart mobility solutions and widespread adoption of electric and autonomous vehicles. Europe is growing at a CAGR of 10.86%, driven by stringent regulations, a high level of technological adoption, and the strong presence of Volkswagen, BMW, and Mercedes-Benz. North America remains the largest region, with a 34.0% share in 2025.
Competitive Strategies and Recent Developments
The market includes automotive manufacturers, technology providers, and telecommunications companies. NVIDIA and Intel focus on AI and machine learning solutions to improve vehicle automation, while Qualcomm focuses on 5G-enabled solutions for faster and more reliable vehicle communication. In April 2026, Stellantis announced a five-year strategic collaboration with Microsoft, involving joint teams developing over 100 AI initiatives across operations, sales, and customer care.
More Trending Latest Reports By Polaris Market Research:
how-technology-is-transforming-every-industry
construction-management-software-market
light-switches-and-electrical-sockets-market
universal-remote-controls-market

Trapstar has earned attention in contemporary streetwear through bold designs, urban influences, and clothing that encourages personal expression. Its fashion identity connects everyday comfort with distinctive graphics and confident styling choices. For people who enjoy modern casualwear, the brand offers inspiration for creating outfits that feel expressive without becoming complicated. Streetwear is more than following popular clothing trends because it allows individuals to communicate their interests through colours, shapes, and accessories. Understanding Trapstar design approach, material choices, cultural relevance, and styling potential can help fashion enthusiasts make better wardrobe decisions and develop a look that reflects their personality.
The Creative Ideas Behind Trapstar Fashion
Designs That Make an Impression
Trapstar clothing often attracts attention through noticeable graphics, lettering, and strong visual contrasts. These details give individual pieces character and help distinguish them from basic everyday garments. A graphic top can become the main feature of an outfit, while simpler trousers and sneakers provide balance. This combination works particularly well for people who appreciate expressive fashion but prefer uncomplicated styling. The most effective outfits allow each item to contribute something without competing for attention. Choosing designs that genuinely appeal to personal taste makes streetwear feel more authentic and helps create combinations that remain enjoyable beyond short lived fashion trends.
Inspiration From Urban Environments
Urban fashion draws inspiration from the surroundings, communities, and creative movements that shape city life. Trapstar shirt fits within this wider landscape through clothing associated with confident self expression and contemporary street culture. Its visual direction can appeal to people who appreciate music, creative communities, and relaxed everyday clothing. Rather than treating an outfit as something purely functional, enthusiasts often use fashion to communicate their interests and individuality. This makes streetwear a flexible form of personal expression. People can adapt the same influence differently, creating outfits that reflect their own experiences instead of copying another person's complete appearance.
A Balance Between Boldness and Simplicity
An outfit does not need numerous statement pieces to look distinctive. One noticeable Trapstar garment can provide enough character when paired with uncomplicated wardrobe essentials. Neutral trousers, clean footwear, and carefully chosen accessories help create a balanced appearance. Alternatively, people who enjoy experimental fashion can combine contrasting colours or different textures. The important consideration is how the pieces work together. Looking at the complete outfit before adding extra details can prevent unnecessary clutter. This balance allows clothing to remain expressive while preserving comfort and making everyday styling easier for different occasions..
Trapstar Within Contemporary Streetwear Culture
Fashion as a Form of Expression
Clothing gives people an everyday opportunity to express their preferences without needing words. Streetwear can reflect musical interests, creative influences, and connections to different communities. It provides one option for people who enjoy clothing with a noticeable urban identity. Each wearer can interpret that identity differently through their choice of colours, footwear, and accessories. Someone may prefer a simple combination built around one graphic garment, while another person might experiment with layered pieces. Both approaches can communicate individual taste.
The Role of Graphic Details
Graphics influence how an outfit is perceived and can give a simple garment a distinctive focal point. Large prints often create a stronger statement, while smaller details may provide a more understated appearance. When styling clothing, consider the size and placement of its graphics alongside other outfit elements. A printed top usually pairs well with less decorated trousers when a balanced look is the goal. Coordinating colours can also connect different pieces without making them identical.
Developing a Recognisable Look
A personal fashion identity develops through repeated choices rather than a single purchase. People often discover their preferred style by experimenting with different fits, colour combinations, and accessories. pieces can become part of this process when they suit existing wardrobe habits. Start by identifying the garments you wear most often and consider which new designs would complement them. Trying a few combinations at home can reveal unexpected options without requiring additional spending.
Completing the Outfit With Accessories
Accessories can bring together an outfit when they serve a clear purpose. Sneakers, caps, crossbody bags, and simple jewellery may complement Trapstar clothing depending on the chosen look. Footwear with a clean design can balance graphic garments, while more substantial shoes create a stronger streetwear appearance. Consider colour and proportion when selecting additional pieces. Wearing too many accessories may distract from the clothing itself, so begin with a few useful details.
Reasons to Consider Trapstar for Your Wardrobe
Versatility Across Different Outfits
Versatile clothing works with several items already in your wardrobe. Trapstar garments can be combined with denim, casual trousers, shorts, and suitable outerwear, depending on their design. This flexibility allows shoppers to create different looks without purchasing a completely new outfit each time. Neutral colours can be especially useful because they coordinate with many
Shopping With Greater Confidence
A careful shopping process helps reduce disappointment. Review product photographs, sizing information, fabric descriptions, and return policies before placing an order. Choose reputable sellers and investigate unclear product details, particularly when authenticity is important. Extremely low prices and vague seller information deserve additional attention. Remember that availability, shipping conditions, and return options can vary between retailers.
Choosing Pieces That Suit You
The best clothing choices reflect individual preferences, daily routines, and comfort requirements. Consider which colours you enjoy wearing, how much layering suits your environment, and what fit feels natural. Trapstar can complement a wardrobe when its designs match these needs. There is no requirement to adopt every trend or recreate another person's outfit exactly. Instead, combine selected pieces with familiar essentials and experiment with different styling options.
Shape Your Own Streetwear Direction
Trapstar offers inspiration for people who appreciate contemporary urban fashion, expressive graphics, and flexible everyday styling. Its clothing can work with different preferences when shoppers pay attention to material, fit, colour, and practical use. Creative combinations, comfortable footwear, and carefully selected accessories can turn familiar garments into distinctive outfits. Responsible shopping and proper garment care also help make wardrobe decisions more worthwhile. Ultimately, personal style does not depend on owning every popular item. It develops through thoughtful choices and confidence in what feels right. Explore different combinations, choose pieces that suit your lifestyle, and let your wardrobe communicate your individuality.
Trapstar brings urban inspiration into everyday personal style.
Food Container Market: Exploring Plastic, Glass, Metal, and Paper-Based Solutions
By emmaverghise, 2026-10-22
The global Food Container Market was valued at USD 351.14 billion in 2025 and is projected to reach USD 367.54 billion in 2026 and USD 531.76 billion by 2034, growing at a CAGR of 4.7% during the forecast period 2026–2034. Market expansion is closely tied to rising worldwide consumption of packaged food, along with the convenience containers offer in packaging, carrying, and transporting food products. Key players operating in the Food Container Market include Amcor plc, Ardagh Group, Ball Corp., Berry Plastics Corp., Graham Packaging Company, Inc., Plastipak Holdings, Inc., Silgan Holdings, Inc., Sonoco Products Company, Tetra Pak, and Weener Plastics.
Convenience and Shelf Life Underpin the Food Container Market
The range of packaged food products spans ready-to-eat (RTE) meals, frozen meals, cake mixes, desserts, RTE convenience foods, and snacks. As demand for these products is projected to rise, manufacturers are expected to expand production capacities, which in turn boosts demand for food containers throughout the forecast period. Demand for packaged food also increased during the pandemic given the essential nature of food items, while established brands with strong market penetration and supply chains sustained container demand in several economies. Food containers also play a crucial role in extending shelf life by preserving products and protecting them from deterioration.
Durability and Lightweight Design Drive Rigid Packaging Demand
Growing demand for rigid plastic containers in food and beverage packaging is a key driver of market growth. Characterized by unyielding shapes, rigid plastic containers are valued for durability and lightweight attributes that contribute to product safety and prolonged shelf life by shielding contents from moisture, light, and chemicals. Their light weight also makes them an efficient option for storing and transporting food products and beverages. Evolving lifestyles and heightened consumer expenditure on packaged goods are expected to further elevate demand for rigid plastic containers across the food and beverage sectors.
Plastic Leads the Food Container Market by Material
By material, the market is segmented into glass, plastic, metal, and others. The plastic segment held the largest revenue share of 58.4% in 2025. Plastic food containers are lighter, highly energy-efficient to manufacture, and more cost-effective than metal and glass alternatives. According to the American Chemistry Council, packaging 10 gallons of drinks requires only two pounds of plastic resins, compared with eight pounds of steel, three pounds of aluminum, and around forty pounds of glass. Plastic food containers are produced from resins including HDPE, LDPE, PET, PP, and polystyrene.
Read More @ https://www.polarismarketresearch.com/industry-analysis/food-container-market
Comparing Plastic, Glass, and Metal Formats
Material selection depends on application requirements. Glass food containers are rated high for durability, recyclability, and sustainability, and offer excellent food preservation, making them suited to home storage and premium packaging, although they are heavier and higher in cost. Metal food containers are rated very high for durability and recyclability, deliver excellent preservation at medium-to-high cost, and are best suited to canned food and industrial packaging, though they are not microwave compatible. Plastic food containers rate low on cost and very light on weight, with moderate durability and recyclability, and selected types are microwave compatible, which suits takeaway and packaged food applications.
Asia Pacific Leads the Regional Landscape
Asia Pacific was the largest regional market in 2025 with a 45.1% revenue share, driven by rapid expansion of the food processing industry and supported by robust government initiatives. Countries such as India, China, and Japan play pivotal roles in regional growth.
Competitive Landscape and Regulatory Considerations
The market is characterized by intense competition, with established players relying on advanced technology, high-quality products, and a strong brand image to drive revenue growth. Companies pursue research and development, mergers and acquisitions, and technological innovation to expand product portfolios and maintain a competitive edge. Supply chain disruptions and transportation restrictions in 2020 reduced the turnover of major companies, including Amcor plc. Growing consumer awareness of sustainability and environmental concerns is also expected to influence the market, while strict environmental regulations on plastics are expected to limit the use of plastic containers.
More Trending Latest Reports By Polaris Market Research:
security-operation-center-market
global-super-absorbent-polymer-sap-market
examining-leading-top-7-companies-in-the-electric-clothes-dryer-market